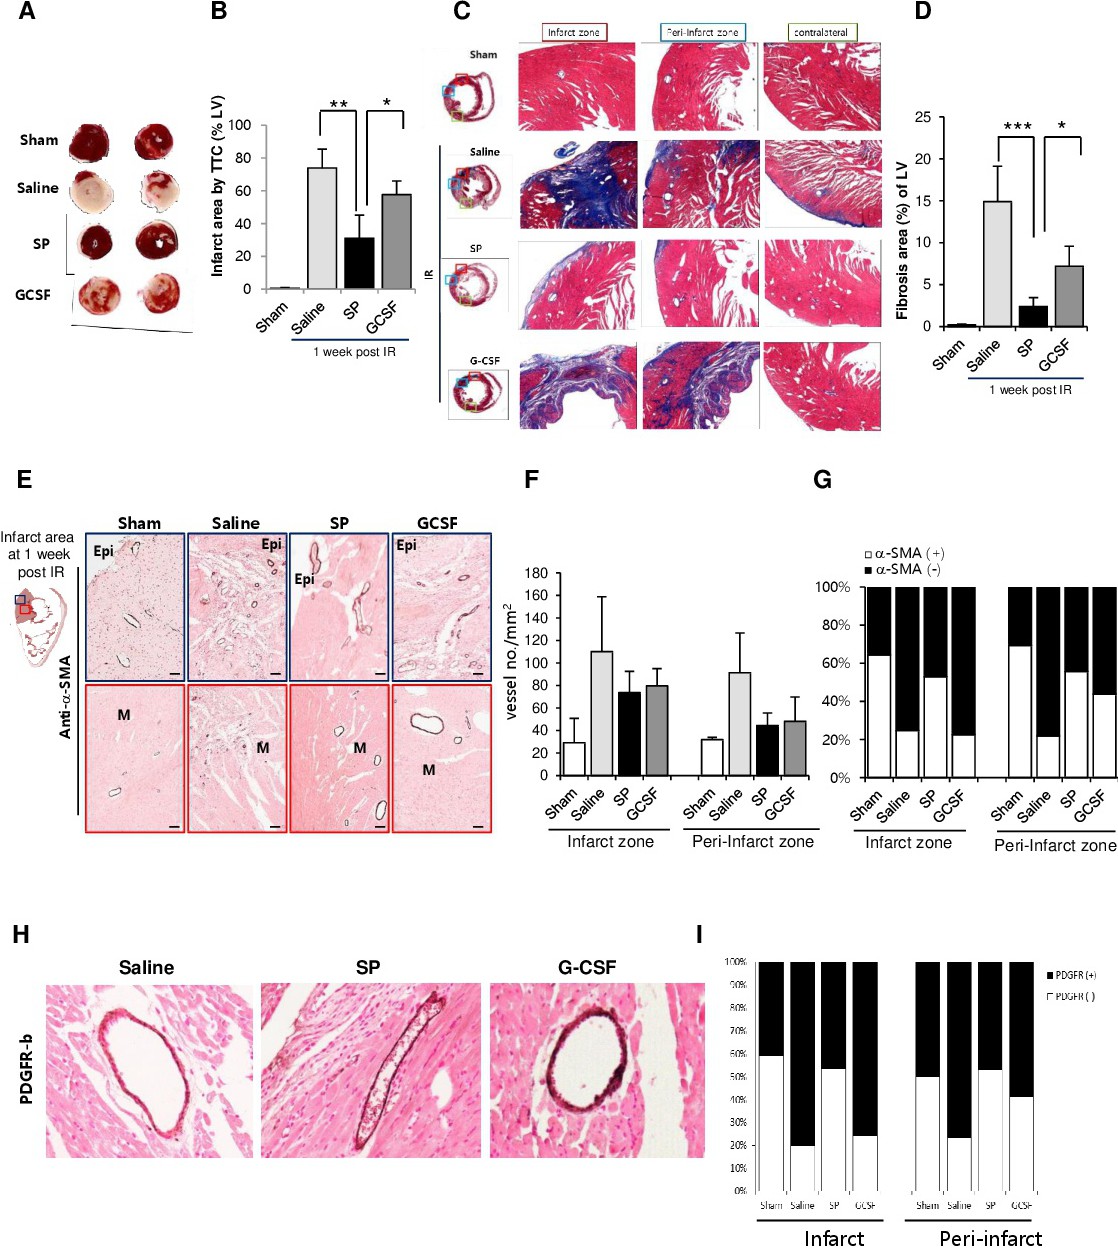
Fig. 6. Substance P (SP)-mediated improvement by reducing the infarction size and fibrosis and by increasing revascularisation with α-SMA-covered vessels, compared with these parameters after granulocyte colony-stimulating factor (GCSF) injection. (A) Representative images of the infarct zone after triphenyltetrazolium chloride (TTC) staining. (B) Quantitative analysis of the TTC-positive area. (C, D) Masson trichrome (MTC) staining was performed to measure fibrosis. (E) Immunohistochemical staining for the pericyte marker, α-SMA, in the infarct and peri-infarct zone. Quantitative analysis of vessel numbers (F) and the ratio of α-SMA+ cell-encircled vessels to the total number of vessels (G). (H, I) Immunohistochemical staining for PDGFR-b in cardiac tissue post IR. PDGFR-b (+) vessels of total vessels was represented by the percentage. Sham-operated (n = 5), ischemia reperfusion injury (IRI) + saline (n = 10), IRI + SP (n = 10), IRI + GCSF (n = 10). The data are shown as the mean ± SD. *p<0.05, **p<0.01, ***p<0.001.